In this blog, we use data visualization and data analytics to provide some basic understandings of the origin-destination (O-D) flows between stations in a bike-sharing system. Part of this blog is adapted from the following research paper:
- “Examining travel patterns and characteristics in a bikesharing network and implications for data-driven decision supports: Case study in the Washington DC area,” Journal of Transport Geography, vol. 71, 2018.
![[PDF]](http://www.wiomax.com/wp-content/plugins/papercite/img/pdf.png)
![[DOI]](http://www.wiomax.com/wp-content/plugins/papercite/img/doi.png)
![[Bibtex]](http://www.wiomax.com/wp-content/plugins/papercite/img/bib.png)
@Article{Xie2018Bike,
Title = {Examining travel patterns and characteristics in a bikesharing network and implications for data-driven decision supports: Case study in the {Washington DC} area},
Author = {Xiao-Feng Xie and Zun-Jing Wang},
Journal = {Journal of Transport Geography},
Volume = {71},
Pages = {84--102},
PDF={http://www.wiomax.com/team/xie/paper/JTRG18Pre.pdf},
Doi = {10.1016/j.jtrangeo.2018.07.010},
Year = {2018}
}
We use the system data of Capital Bikeshare between 2012-2016. The top 20 bike stations with the most pickups are listed in the following table, and the O-D flows between these bike stations are shown in Fig. 1 (The interactive diagram is built based on the code in D3). For the link each O-D pair, the thickness at each end encodes the normalized proportion of bikeshare pickups between two stations (the numbers will be shown if moving mouse on each link), and the color follows the station with more pickups. It is easy to find the flows between O-D pairs are often asymmetric. For example, the proportions are respectively 2.4% and 1.2% for 31258 → 31249 and 31249 → 31258. Some bikeshare stations (e.g., 31247 and 31248, both are located in the National Mall) have significant “loop” trips, i.e., the trips of pickup and drop-off at the same station.
| Id | Name | Id | Name |
| 31101 | 14th & V St NW | 31238 | 14th & G St NW |
| 31104 | Adams Mill & Columbia Rd NW | 31241 | Thomas Circle |
| 31110 | 20th St & Florida Ave NW | 31247 | Jefferson Dr & 14th St SW |
| 31200 | Massachusetts Ave & Dupont Circle NW | 31248 | Smithsonian-National Mall / Jefferson Dr & 12th St SW |
| 31201 | 15th & P St NW | 31249 | Jefferson Memorial |
| 31203 | 14th & Rhode Island Ave NW | 31258 | Lincoln Memorial |
| 31214 | 17th & Corcoran St NW | 31600 | 5th & K St NW |
| 31222 | New York Ave & 15th St NW | 31613 | Eastern Market Metro / Pennsylvania Ave & 7th St SE |
| 31228 | 8th & H St NW | 31623 | Columbus Circle / Union Station |
| 31229 | New Hampshire Ave & T St NW | 31624 | North Capitol St & F St NW |
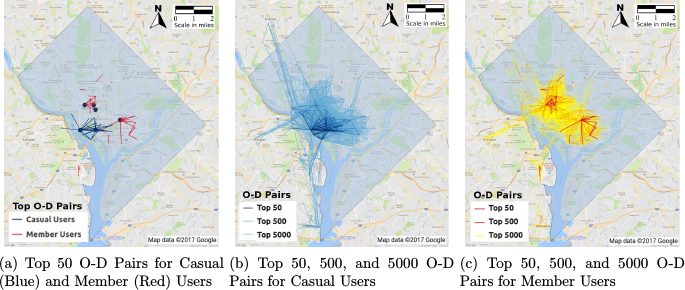
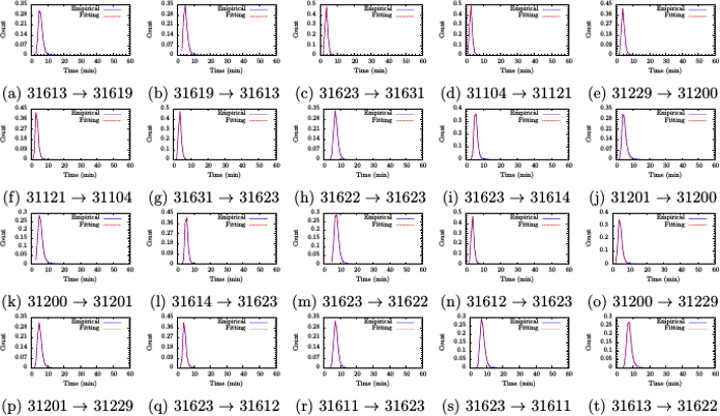
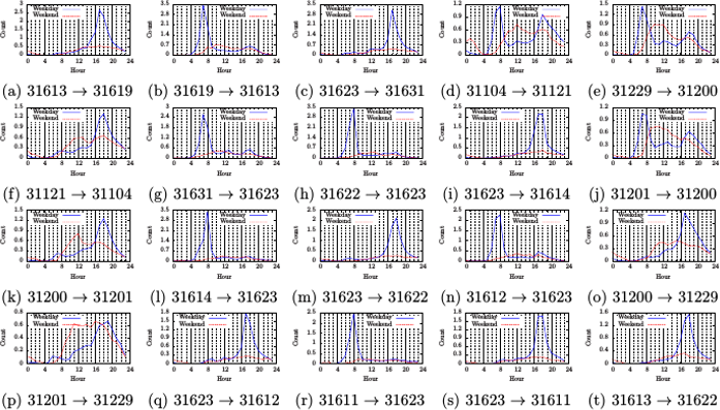
Fig. 3 shows the empirical PDFs of use time for the top 20 O-D pairs in the ranking of the highest O-D flows by member users. Fig. 4 gives the comparison of average daily counts of the trips between weekdays (blue) and weekends (red) for the top 20 O-D pairs. Although the distributions of use time by member users for all the top 20 O-D pairs express a similar pattern on a utilitarian purpose — with a single sharp peak that can be fitted into the lognormal distribution (see Fig. 3), their daily trip counts show diverse patterns (see Fig. 4, especially the blue curves for weekdays on the same trip purpose). These patterns give us additional information on the land use near origin and destination stations (such as workplace or high-density residence) as well as more detailed trip purpose of an O-D pair  (such as for commuting or for non-commuting).
Here we present a few decision rules based on associated knowledge. First, a dominant AM or PM peak of trip counts in weekday indicates that the trip purpose between the O-D pair is for commuting. Let R, W, and T respectively be a residence, workplace, and transportation hub. Basic commuting trip segments include H → W, H → T, T → T, and T → W during the AM period, and W → H, W → T, T → T, and T → H during the PM period. If one and only one station (either  or
or  ) is T, we can define the following {\em commuting-related} rule (
 ): is H if is T and is W if is T given a dominant AM peak, whereas is W if is T and is H if is T given a dominant PM peak.
Let us take the O-D pairs in Fig. 4 as an example to illustrate the usage of the rule. The Stations 31121, 31200, 31613, and 31623 are known respectively adjacent to four transportation hubs (Metrorail and railway stations) of Woodley Park, Dupont Circle, Eastern Market, and Union Station. Based on the rule and the patterns shown in Fig. 4, we can identify that the eight stations, i.e. Stations 31201, 31229, 31611, 31612, 31614, 31619, 31622, and 31631, are located in primary residence neighborhoods. This is consistent with the result in CENSUS data analytics, where the LODES data by residence confirmed that seven and one of the eight stations are respectively located in the high-density residential census tracts with  in
in ![[4.0,4.5]](http://www.wiomax.com/wp-content/ql-cache/quicklatex.com-66836e96835b93bed0193425e45704a5_l3.png "Rendered by QuickLaTeX.com") and
and ![[3.4, 4.0]](http://www.wiomax.com/wp-content/ql-cache/quicklatex.com-7c19ee9bbdbab54d5f53fd467618b073_l3.png "Rendered by QuickLaTeX.com") . Among the top 20 O-D pairs in the ranking of the highest O-D flows by member users, 17 are the O-D links between the four T stations and the eight H stations, i.e. all the top O-D pairs in Fig. 4 are T → H or H → T except for Figs. 4d, 4f and 4p. It indicates that bikesharing plays an important role in providing first- and last-mile connections between residence places and transportation hubs.
. Among the top 20 O-D pairs in the ranking of the highest O-D flows by member users, 17 are the O-D links between the four T stations and the eight H stations, i.e. all the top O-D pairs in Fig. 4 are T → H or H → T except for Figs. 4d, 4f and 4p. It indicates that bikesharing plays an important role in providing first- and last-mile connections between residence places and transportation hubs.
We can also define decision rules to identify the land use related to non-commuting trips. In the {nightlife-related} rule ( ), or is likely located near a nightlife area, if there is a nontrivial trip rate during 0–4 AM in weekend. For example, in Fig. 4d, the station 31104 is at Adams Morgan, which is a major night life area with many bars and restaurants.
![]() By Xiao-Feng Xie, Ph.D. —— The WIOMAX Blog
By Xiao-Feng Xie, Ph.D. —— The WIOMAX Blog
WIOMAX is a research and consulting team to explore real-time, smart and scalable solutions especially for applications to achieve Smart Mobility and Smart Cities by integrating cutting-edge DOAI [Data Analytics + Optimization + Artificial Intelligence (AI) + Internet of Things (IoT)] technologies, from basic research to industry transition and product development and support.