
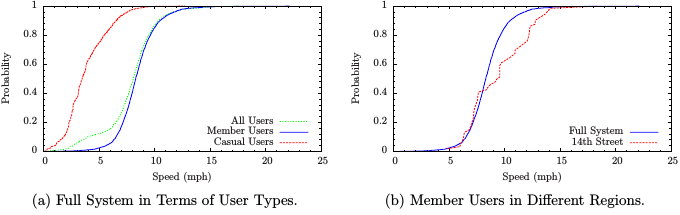
In urban mobility, travel or trip speed is important. For each bicycle trip, its bikeshare use time provides an upper bound of travel time. Particularly, for the utilitarian O-D trips, the bikeshare use time approaches the travel time if there is no intermediate stop. Therefore, we can estimate the lower bound of trip speed for member users using the bikeshare use time and the shortest path length between each O-D pair, without requiring extensive GPS tracking data. Fig. 1a gives the distribution of median speed  for all the O-D pairs with more than 1000 trips taken by bikeshare users. For each O-D pair, we compute
  , where
  is the distance of the recommended bicycling route between the O-D pair retrieved with Google Maps Distance Matrix API,
  is the median bikeshare use time for the O-D pair. For casual, member, and all users, the medians values of are respectively 3.48, 8.31, and 8.08 mph. Comparison between member and all users shows a significant difference in the 10th percentile values of , which are respectively 6.54 and 4.00 mph.
Concerning the traditional vehicle flow, traffic congestion has been a serious problem. Let the free flow, average, and 95th percentile travel times respectively be  ,
,  , and
, and  , the {\em Travel Time Index} (TTI) and {\em Planning Time Index} (PTI) are respectively
(1) 
as defined in the Urban Congestion Reports (UCR) by FHWA. According to UCR, during the last quarter of 2016, DC had TTI=1.48 and PTI=3.08, and the average duration of daily congestion lasted for nearly 8 hours. According to the District Mobility website, some road segments have severe congestion with TTI  3.5 during peak time. Notice that the maximum lawful speed is 25 mph on most streets in DC. Thus, an extremely high TTI means a rather slow traffic speed.
Congestion affects both travel time and reliability of vehicles. In general, congestion factors do not have effects on bike users as much as on car and bus transit users. With the current median speed of about 8 mph, bicycling is certainly a viable commuting option in urban transportation, as compared to other surface transportation modes. In particular, if travel time reliability is important for users, bicycling might be a better choice during peak time. Compared to bicycling, although driving might save travel time in terms of the free flow speeds, the variation in vehicle travel time is rather large in rush hours with a high TTI and PTI for vehicles, where a delay can even reach several times of the travel time savings. According to the 2016 member survey, 89% of respondents cited access and speed as their primary reasons for joining CaBi.
The speed for CaBi members is still far below than the average cycling speed that could reach 14.6 mph. It is likely due to the high density of intersections in urban area imposing unnecessary delays for cyclists. At this point, smart multimodal intersection control can help to gain a better biking mobility while without any significant interruption to existing vehicle flows. The improvement in bike mobility might further promote more bike usage as a part of the green intermodal transportation system, and accelerate the traffic mode shift towards reducing VMT and mitigating traffic congestion as well as vehicle emissions.
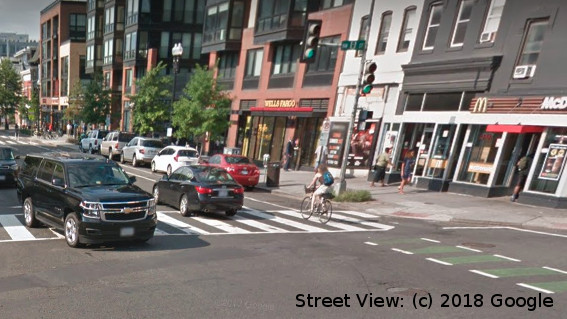 It is important to understand the dependence of bike mobility on the network infrastructure. For urban planners and policymakers, such knowledge could provide critical supports to upgrade the bike infrastructure in multimodal urban transportation networks. To gain some insights, a case study is performed on a dedicated bike lane with bikeshare stations. The bike lane is on the 14th Street between Station 31407 at Colorado Ave and Station 31241 at Thomas Circle. There are 12 CaBi stations in total(i.e., 31101, 31105, 31119, 31123, 31124, 31202, 31203, 31241, 31401, 31402, 31406, 31407) on the bike lane, and the O-D trips among these stations are considered. Only member users are considered for evaluating the bike mobility of utilitarian trips. It is reasonable to assume that nearly all these bikeshare users will follow the route on the 14th Street, since it is the shortest route and it is a dedicated bike lane. Fig. 1b shows the difference in bike mobility between the full system and the selected region on the 14th Street. Compared with the full system, there are more percentiles of users at the higher travel speeds on the 14th Street. For a travel speed over 10 mph, the percentages of users are respectively 37.68% and 14.88% on the 14th Street and in the full system. The result indicates that bike mobility could be significantly improved on dedicated bike lanes.
![]() By Xiao-Feng Xie, Ph.D. —— The WIOMAX Blog
By Xiao-Feng Xie, Ph.D. —— The WIOMAX Blog
This blog is adapted from the following research paper:
- “Examining travel patterns and characteristics in a bikesharing network and implications for data-driven decision supports: Case study in the Washington DC area,” Journal of Transport Geography, vol. 71, 2018.
![[PDF]](http://www.wiomax.com/wp-content/plugins/papercite/img/pdf.png)
![[DOI]](http://www.wiomax.com/wp-content/plugins/papercite/img/doi.png)
![[Bibtex]](http://www.wiomax.com/wp-content/plugins/papercite/img/bib.png)
@Article{Xie2018Bike,
Title = {Examining travel patterns and characteristics in a bikesharing network and implications for data-driven decision supports: Case study in the {Washington DC} area},
Author = {Xiao-Feng Xie and Zun-Jing Wang},
Journal = {Journal of Transport Geography},
Volume = {71},
Pages = {84--102},
PDF={http://www.wiomax.com/team/xie/paper/JTRG18Pre.pdf},
Doi = {10.1016/j.jtrangeo.2018.07.010},
Year = {2018}
}
WIOMAX is a research and consulting team to explore real-time, smart and scalable solutions especially for applications to achieve Smart Mobility and Smart Cities by integrating cutting-edge DOAI [Data Analytics + Optimization + Artificial Intelligence (AI) + Internet of Things (IoT)] technologies, from basic research to industry transition and product development and support.