Road traffic safety is a serious issue raising increased public concerns. According to the 2015 report by World Health Organization (WHO), globally there were 1.25 million road traffic deaths in 2013, and up to 50 million more per year suffering injuries as a result of road traffic crashes. In USA, 35,485 people died and 2.4 million people injured in 6.3 million police-reported traffic crashes in 2015, according to the statistics by National Highway Traffic Safety Administration (NHTSA). Improving road safety has been the focus of multiple initiatives, such as Vision Zero, Road to Zero Coalition, and Toward Zero Deaths (TZD).
Here are some case studies that WIOMAX researchers and engineers have done on understanding and improving multimodal road traffic safety using smart DOAI (Data Analysis+Optimization+Artificial Intelligence (AI)+Internet of Things (IoT)) technologies.
Biking Safety Analysis: Washington, DC |
|---|
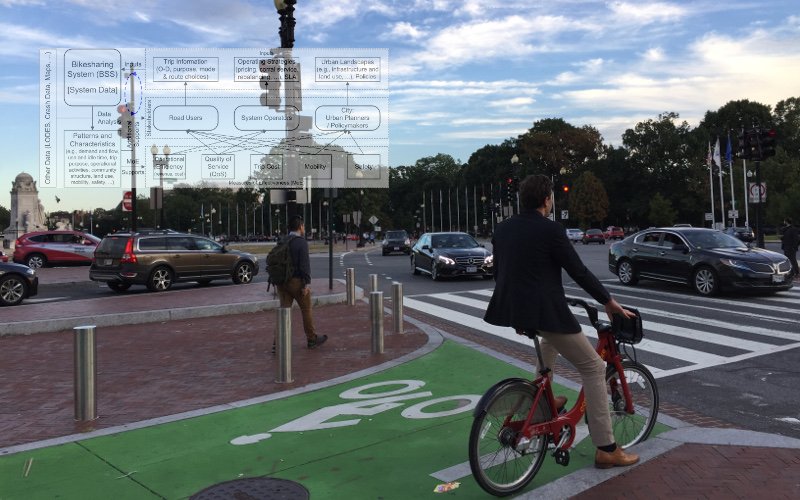
According to the combined data of the traffic safety statistics of 2013-2015 from DDOT and the crash data from Open Data DC, there were 707.4 bike crashes per year in average between 2012-2016, where 46.8 bicyclists were fatal or major injured and 436.6 were minor injured.
- “Examining travel patterns and characteristics in a bikesharing network and implications for data-driven decision supports: Case study in the Washington DC area,” Journal of Transport Geography, vol. 71, 2018.
![[PDF]](http://www.wiomax.com/wp-content/plugins/papercite/img/pdf.png)
![[DOI]](http://www.wiomax.com/wp-content/plugins/papercite/img/doi.png)
![[Bibtex]](http://www.wiomax.com/wp-content/plugins/papercite/img/bib.png)
@Article{Xie2018Bike,
Title = {Examining travel patterns and characteristics in a bikesharing network and implications for data-driven decision supports: Case study in the {Washington DC} area},
Author = {Xiao-Feng Xie and Zun-Jing Wang},
Journal = {Journal of Transport Geography},
Volume = {71},
Pages = {84--102},
PDF={http://www.wiomax.com/team/xie/paper/JTRG18Pre.pdf},
Doi = {10.1016/j.jtrangeo.2018.07.010},
Year = {2018}
}
 From spatial analysis, the broad spatial distribution of crashes certainly gives a warning that bike safety requires a significant improvement. The heatmap of crashes provides us a visual summary of the most frequent crash regions. We also identified the significant crash hot spots, using the method of Z scores from the Getis-Ord Gi* statistic with 99% confidence. By including the trip demand information, we found that the hot spots of bike crashes have a strong spatial correlation with trip demand.
Smart IoT for Intersection Safety |
|---|
In this project, we have proposed an integrated in-vehicle decision support system to help driver make better and safer stop/go decisions as a vehicle is approaching a signalized intersection.
- “SIV-DSS: Smart in-vehicle decision support system for driving at signalized intersections with V2I communication,” Transportation Research Part C, vol. 90, 2018.
@Article{Xie2018SIV,
Title = {{SIV-DSS}: Smart in-vehicle decision support system for driving at signalized intersections with {V2I} communication},
Author = {Xiao-Feng Xie and Zun-Jing Wang},
Journal = {Transportation Research Part C},
Volume = {90},
Pages = {181--197},
PDF={http://www.wiomax.com/team/xie/paper/TRC18Pre.pdf},
Doi = {10.1016/j.trc.2018.03.008},
Year = {2018}
}
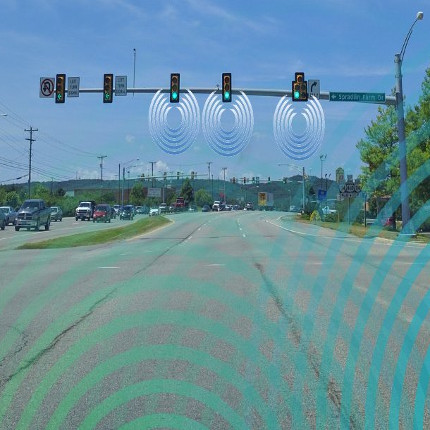 Supported by the IoT communications, the system has integrated and harnessed real-time information from both vehicle and infrastructure. Novel decision rules are designed as smart modules utilizing the key physical and behavioral inputs from vehicle motion, vehicle-driver characteristics, intersection geometry and topology, signal phase and timings, and the definition of red-light running (RLR) law. The performance has been evaluated with systematic simulation experiments. The results indicate that the smart system can not only ensure traffic safety by greatly reducing the probability of RLR violations down to zero, but also improve mobility by significantly reducing unnecessary stops at an intersection.
Road Safety Analysis: Montgomery County, MD |
|---|
In this work, we analyze road safety with an integration of multiple data sources on multiple scales. As a case study, we consider three datasets, including the nationwide Fatality Analysis Reporting System (FARS), the statewide traffic crashes in Maryland (MDCrash), and the countywide traffic violations in Montgomery County, MD (MoCoVio).
- “Multiscale crash analysis: A case study of integrating FARS, Maryland’s crash data, and Montgomery County’s traffic violation data,” in Transportation Research Board (TRB) Annual Meeting, Washington, DC, 2018.
![[DOI]](http://www.wiomax.com/wp-content/plugins/papercite/img/lnk.png)
@InProceedings{xie2018multiscale,
title={Multiscale crash analysis: A case study of integrating {FARS}, {Maryland}'s crash data, and {Montgomery County}'s traffic violation data},
author={Xie, Xiao-Feng and Wang, Zun-Jing},
Booktitle = {Transportation Research Board (TRB) Annual Meeting},
number={18-2283},
Address = {Washington, DC},
LNK={https://trid.trb.org/View/1495254},
PDF={http://www.wiomax.com/team/xie/paper/TRB18.pdf},
year={2018}
}
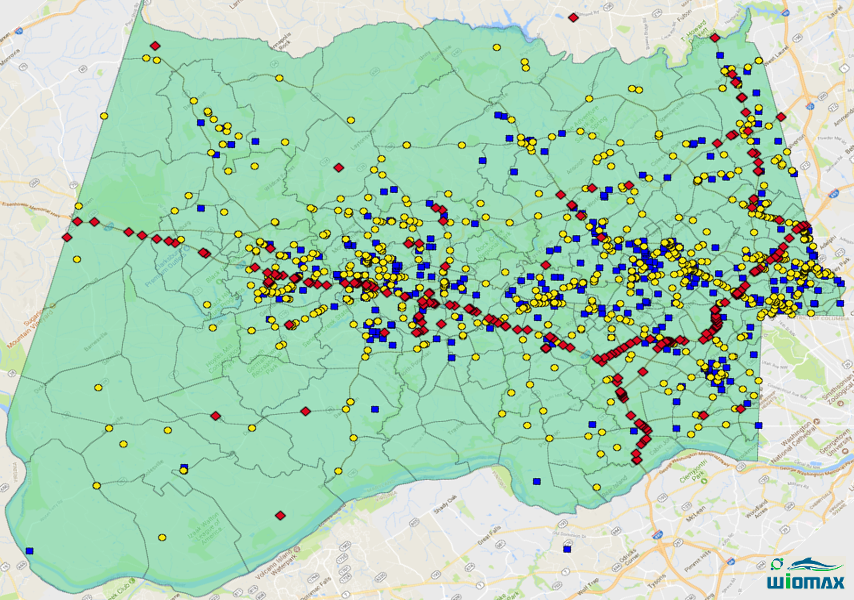 We explore practical values of the multiple data integration on road crash analysis. The crash risk patterns extracted from data fusion is shown to be rather valuable. By identifying determinant risk factors in the patterns, we can better understand the effects of other risk factors. In addition, conditional risk matrix can be computed from data integration to measure the probability of the injury levels and to evaluate the impact of each individual risk factor on injuries. Finally, we conduct a multi-source data integration to discover the safety factors for pedestrians, where we obtain temporal patterns from FARS but acquire spatial patterns from the traffic crash and violation data. The results indicate that, in comparison with only using FARS, integrating multiple data has the power of showing more insights of the patterns on risk factors for traffic crashes, which allows us to not only better optimize limited resources but also realize more effective countermeasures for enhancing road safety.
Road Safety Analysis: City of Pittsburgh, PA |
|---|
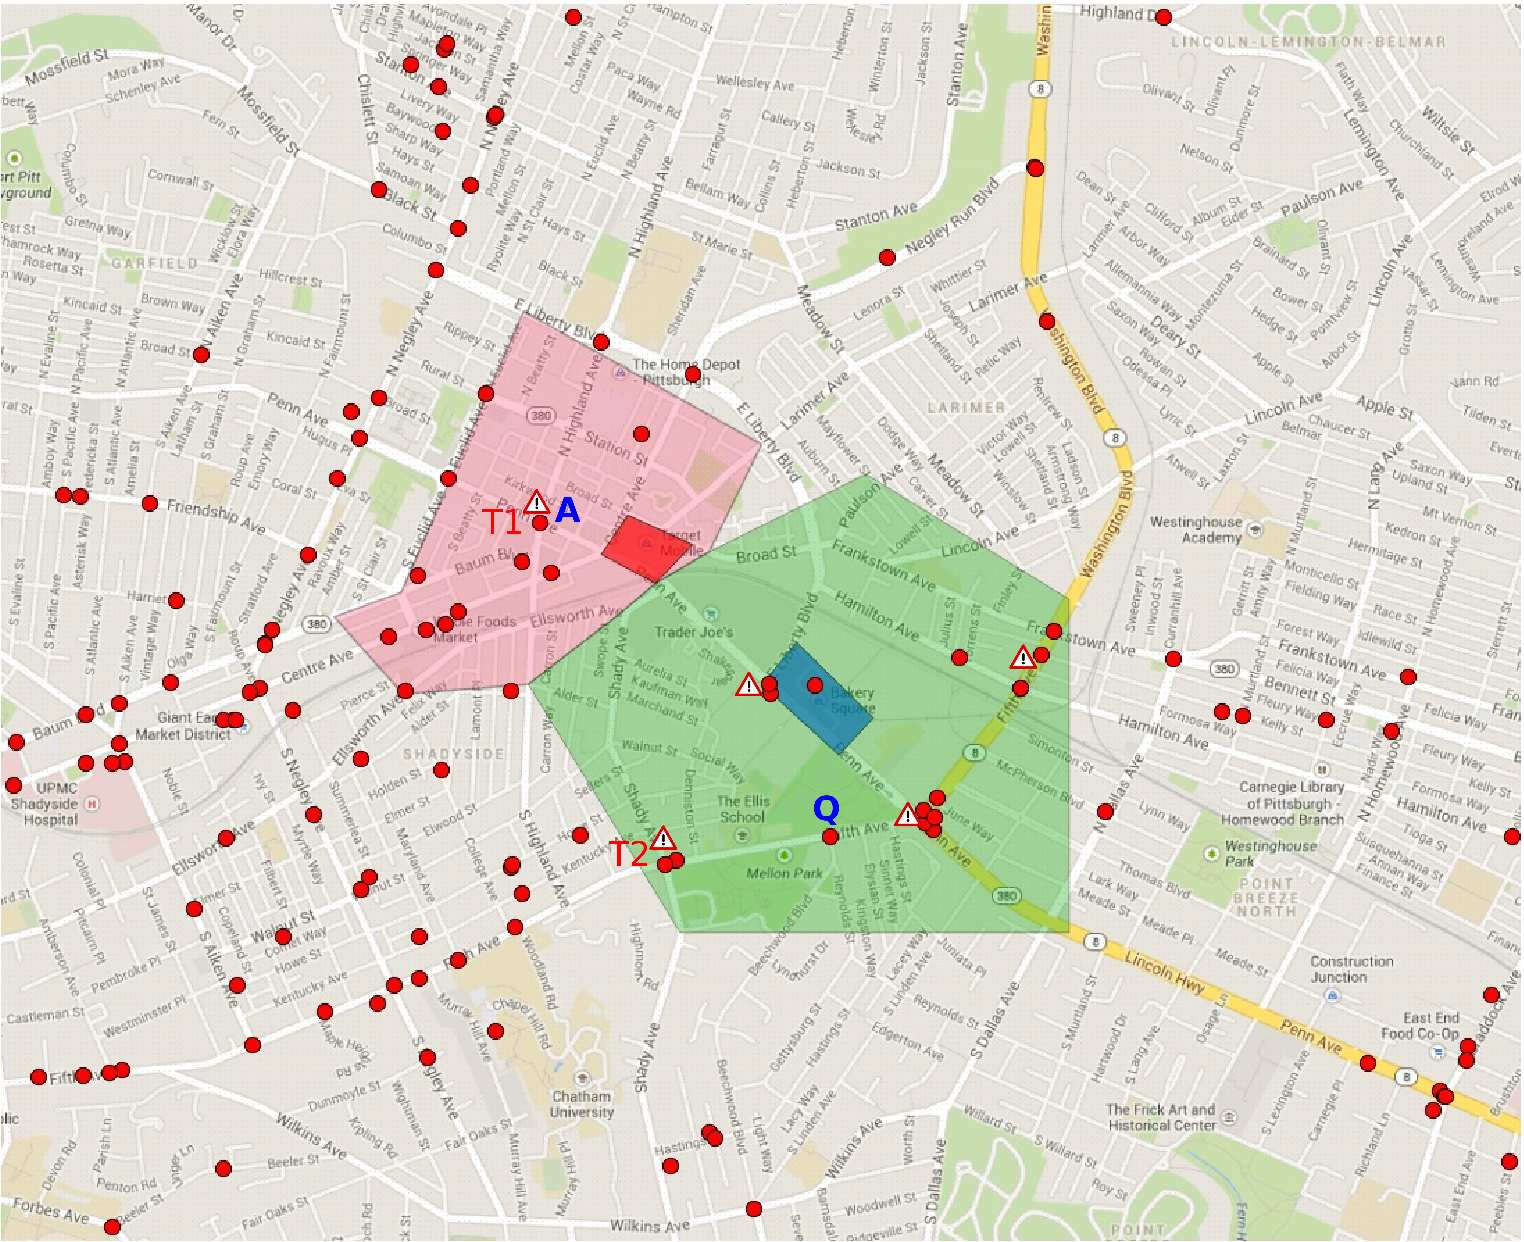
This work combines social media and sensor data to measure the road safety in the Pittsburgh Metropolitan area.
- “An empirical study of combining participatory and physical sensing to better understand and improve urban mobility networks,” in Transportation Research Board (TRB) Annual Meeting, Washington, DC, 2015.
![[PPT]](http://www.wiomax.com/wp-content/plugins/papercite/img/ppt.png)
@InProceedings{Xie2015,
Title = {An empirical study of combining participatory and physical sensing to better understand and improve urban mobility networks},
Author = {Xiao-Feng Xie and Zun-Jing Wang},
Booktitle = {{Transportation Research Board (TRB) Annual Meeting}},
number={3238},
PDF={http://www.wiomax.com/team/xie/paper/TRB15LBSN.pdf},
PPT={http://www.wiomax.com/team/xie/demo/TRB15_demo_BigData_UrbanInformatics.pdf},
LNK={https://trid.trb.org/View/1337999},
Year = {2015},
Address = {Washington, DC}
}
 The collected data contains 3,399,376 checkins of 74,658 users at 2,198,572 venues. The temporal patterns of the checkins for “accident” (as the sub-topic) discloses that people should pay more attention to avoid accidents during the morning rush hours, especially for the peaks.
We found that the spatial checkin distribution is surprisingly broad for the “accident” sub-topic. This implies the importance of further improving the urban road safety (which might be addressed in the emerging autonomous and connected vehicle technology).
Other Research Work on Road Traffic Safety |
|---|