Time series data analysis comprises methods for analyzing time series data in order to extract meaningful statistics and other characteristics of the data.
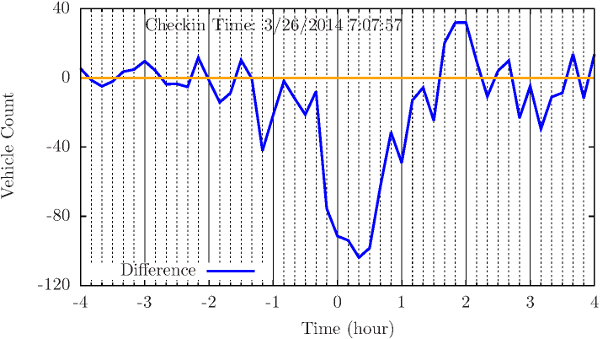
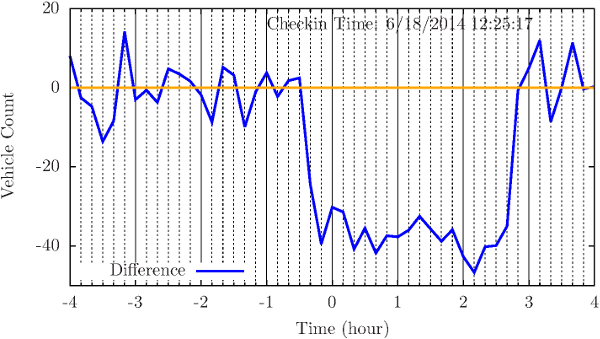
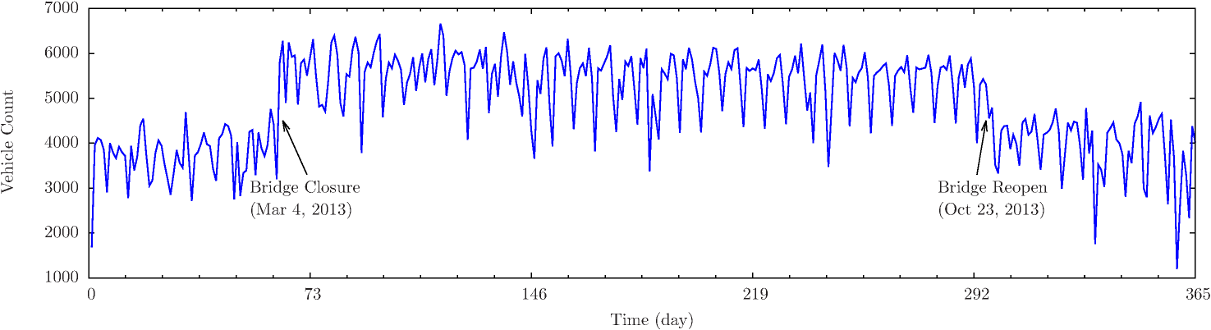
Time series analysis can be widely applied in urban informatics. Using detrending techniques on time series data, short-term disruptions can be clearly identified by the deep deviation for sufficient long time. This provides us straightforward information on how the non-recurrent incident impacts local traffic.
- “An empirical study of combining participatory and physical sensing to better understand and improve urban mobility networks,” in Transportation Research Board (TRB) Annual Meeting, Washington, DC, 2015.
![[PDF]](http://www.wiomax.com/wp-content/plugins/papercite/img/pdf.png)
![[PPT]](http://www.wiomax.com/wp-content/plugins/papercite/img/ppt.png)
![[DOI]](http://www.wiomax.com/wp-content/plugins/papercite/img/lnk.png)
![[Bibtex]](http://www.wiomax.com/wp-content/plugins/papercite/img/bib.png)
@InProceedings{Xie2015,
Title = {An empirical study of combining participatory and physical sensing to better understand and improve urban mobility networks},
Author = {Xiao-Feng Xie and Zun-Jing Wang},
Booktitle = {{Transportation Research Board (TRB) Annual Meeting}},
number={3238},
PDF={http://www.wiomax.com/team/xie/paper/TRB15LBSN.pdf},
PPT={http://www.wiomax.com/team/xie/demo/TRB15_demo_BigData_UrbanInformatics.pdf},
LNK={https://trid.trb.org/View/1337999},
Year = {2015},
Address = {Washington, DC}
}
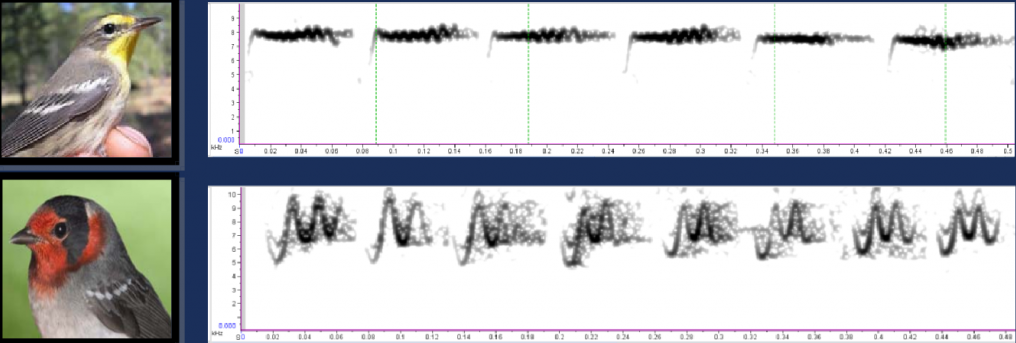
Time series data can also be processed using spectral analysis. For example, to identify songbird species in field recordings, audio files can be processed into spectrogram images by applying Fast Fourier Transform (FFT).